Derivatives Rollover Report |September 28, 2018
The ecstasy of the northward direction halted as we witnessed strong bout of selling on account of depreciating
domestic currency, global trade war, rising crude prices and some concerns over few NBFC’s. In the course of action,
index corrected almost 6% in the September series to conclude tad below the important psychological level of 11000.
Despite this carnage in the broader market, IT counters clearly bucked the trend as we saw giants like ‘INFY’ and
‘TCS’ went on to clock fresh record high.
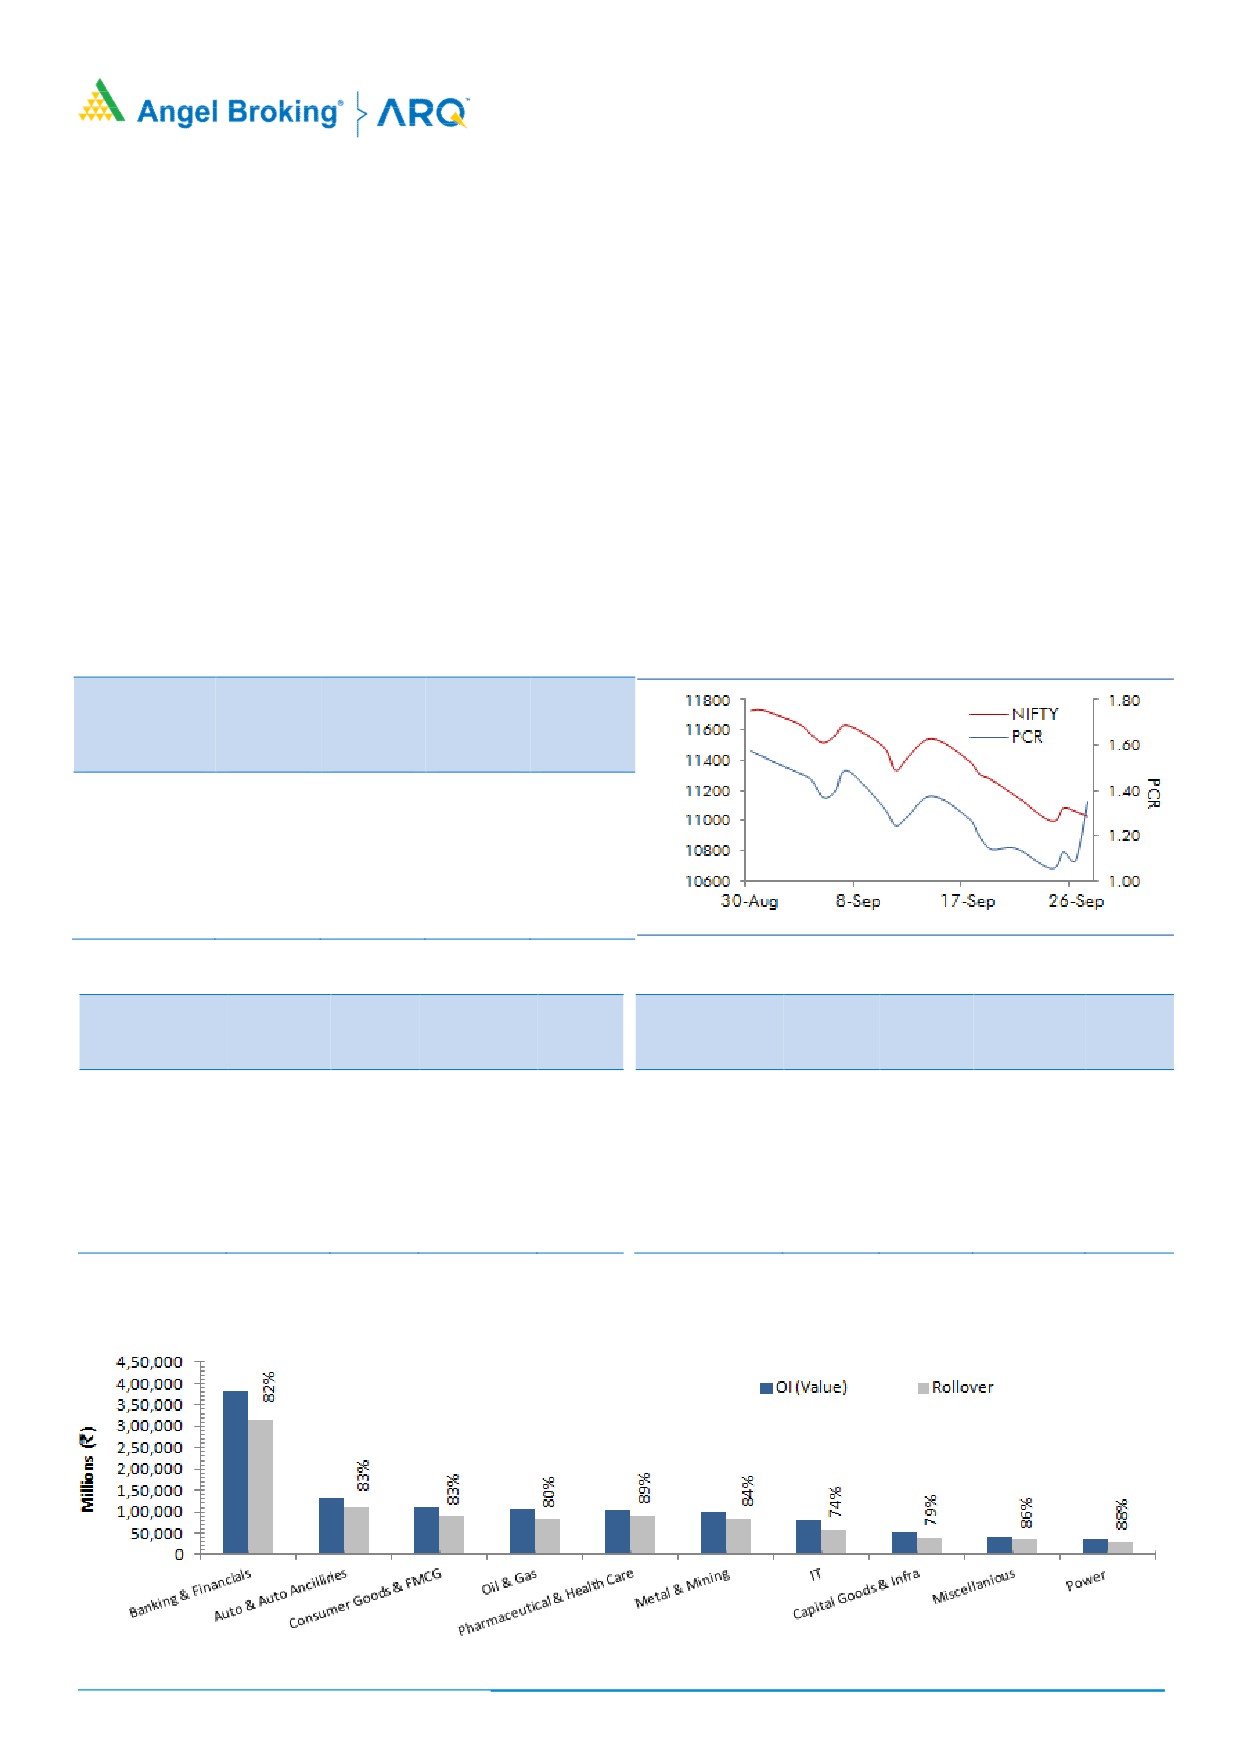
Despite being a volatile series, we hardly saw any meaningful open interest addition in Nifty futures; in fact, OI plunged 30%
series on series. Now, we are started October series with the lowest base for this calendar year. Rollovers for Nifty stood at
62.51%, lower than the 3-month average of 68.21%. Stronger hands (FIIs) added short positions throughout the September
series and also preferred rolling these bearish bets in the coming series. Their index futures ‘Long Short Ratio’ has also
plunged from 64% to 46%. Due to the sharp decline in index; the volatility index has also surged above the hurdle of 16.50
and this certainly does not bode well for the bulls. At current juncture, on the higher side 11500 followed by 11200 call and
on the downside 11000 followed by 10800 puts are attracting traders attention. Considering the rollover data, it’s advisable
to stay light in index unless we see any relevant build-up in either direction.
BankNifty rollovers were on the lower side in terms of percentage (65.64%) as well as OI. Once again, we are starting
the series with lower base. During the series, the banking index corrected almost 11% along with decent shorts and
some of these positions are still intact. Looking at the stock specific action, it seems we may see further weakness
going ahead.
Indices Change
NIFTY & PCR Graph
Price
Change
3 month
INDEX
Price
(%)
Rollover
avg.
NIFTY
10977.55
(5.99)
62.51
68.21
BANKNIFTY
25042.15
(10.71)
65.64
69.77
NIFTYIT
16018.00
2.97
71.01
70.10
NIFTYMID50
4729.40
(11.26)
99.97
99.96
NIFTYINFRA
3045.45
(6.33)
-
-
Monthly Gainers
Monthly Losers
Price
Ol
Price
Ol
Change Open
Change
Change Open
Change
Scrip
Price
(%)
Interest
(%)
Scrip
Price
(%)
Interest
(%)
BIOCON
710.15
16.37
6987600
(1.40)
DHFL
291.85
(56.43)
15234000
(43.43)
AUROPHARMA
745.90
7.64
22219000
5.88
YESBANK
204.80
(43.85)
91189000
61.81
HCLTECH
1099.60
7.27
7390600
(16.99)
JETAIRWAYS
169.15
(41.53)
6534000
20.30
NMDC
118.55
7.24
21138000
(17.99)
SREINFRA
33.10
(39.04)
18186000
(1.07)
WIPRO
321.20
6.92
27112800
11.10
JPASSOCIAT
7.50
(36.71)
107168000
(28.30)
Note: Stocks which have more than 1000 contract in Futures OI.
Note: Stocks which have more than 1000 contract in Futures OI.
For Private Circulation Only
1
Derivatives Rollover Report
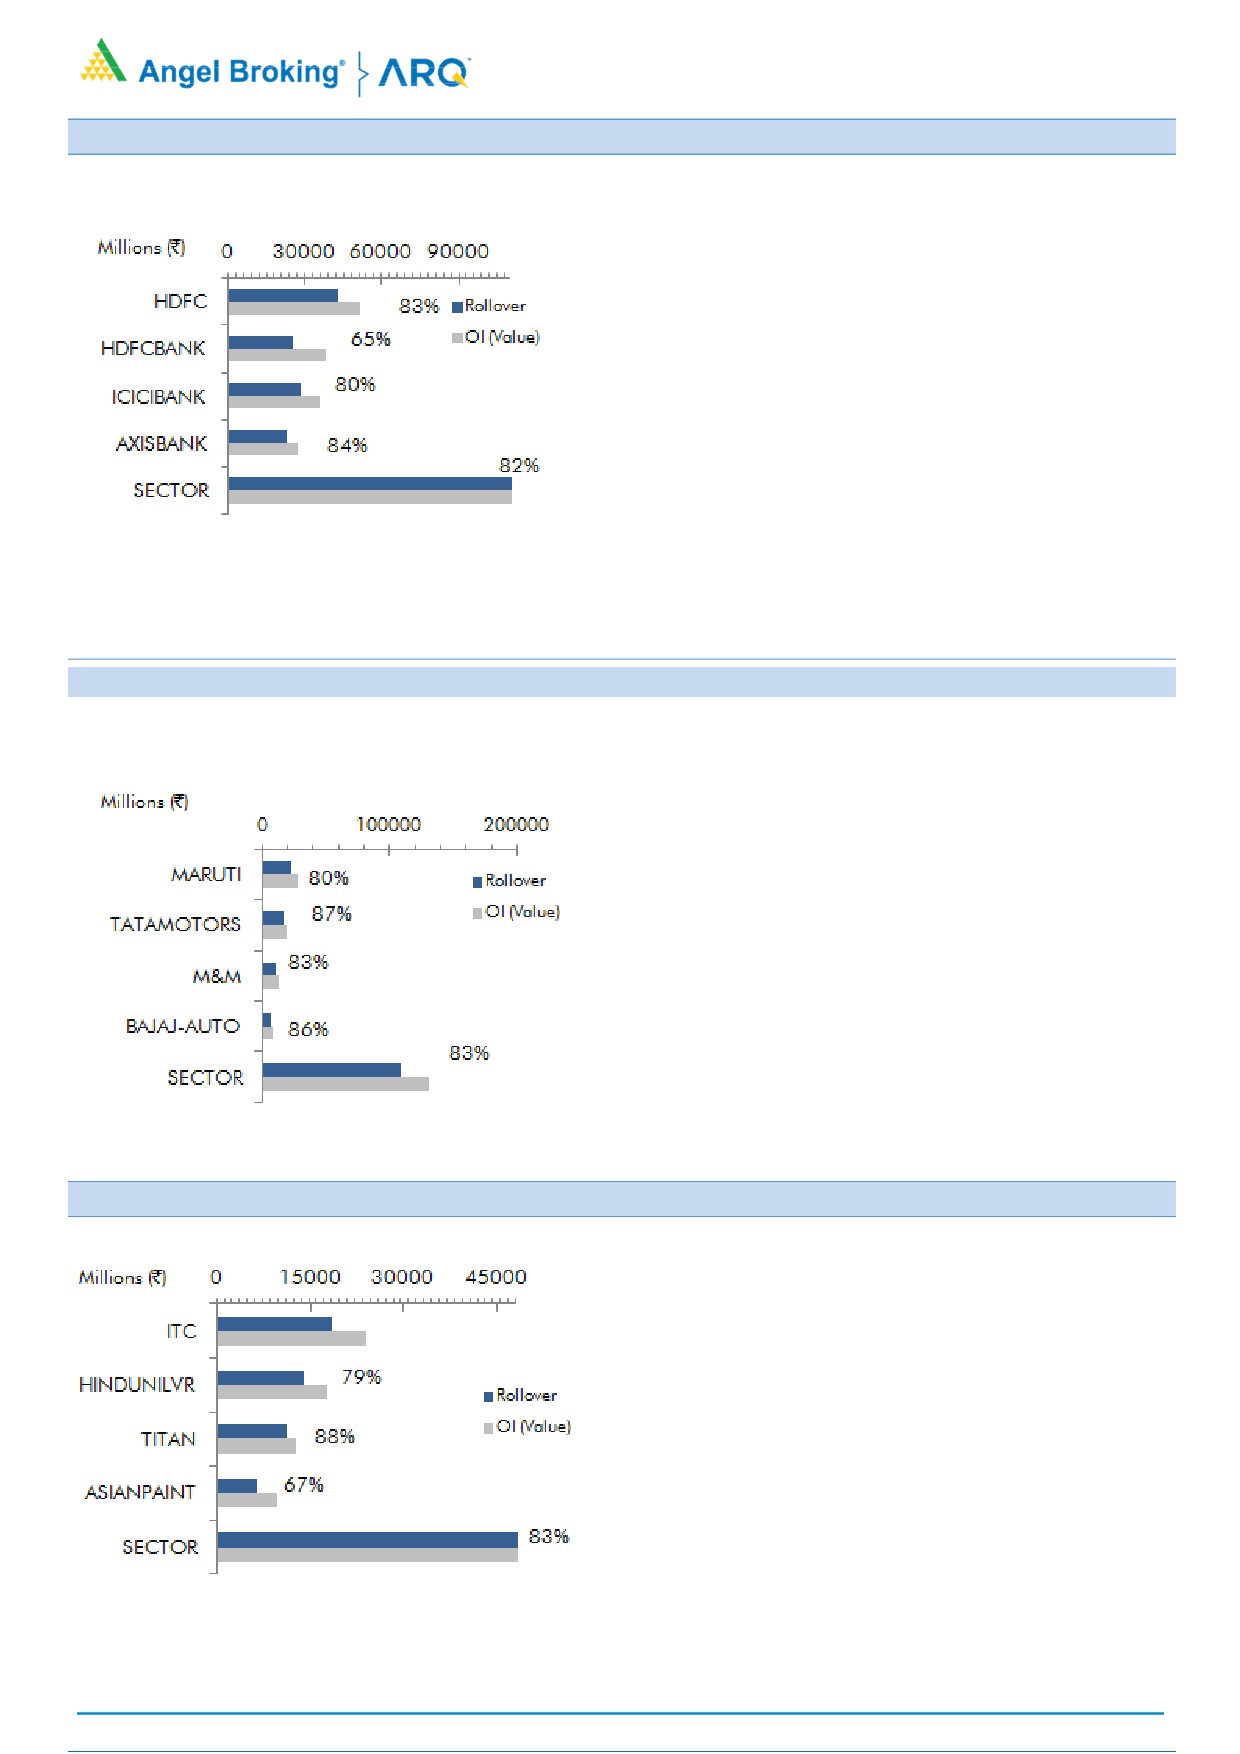
Banking and Financials
YESBANK (83.69%) is one of the top loser and we
also saw massive short formation in the recent
correction. Rollovers are also on the higher side for
this counter. Thus, traders are advised avoid any kind
of bottom fishing.
Post some recovery, BANKBARODA (91.27%) once
again attracted shorts to correct below the support
zone of 110-108. We also saw short rollovers in the
October series. We expect continuation of the recent
fall towards 92-94 levels.
HDFCBANK (65.32%) has lowest rollover in this
space. Last series, we saw extension of fall to correct
yet another 4.47% but hardly saw any short formation
was seen. Since last 2-3 sessions, we are seeing
some buying interest; thus, one can expect some
recovery towards 2025-2030.
Auto & Auto Ancillaries
Post last 8 series, MARUTI (80.26%) is finally is out
from the range of 8000-10000. Last series, we saw a
massive fall of nearly
18% along with short
formation. These positions have also been rolled.
Thus, traders are advised avoid any bottom fishing as
we don’t see any signs of recovery immediately.
BAJAJ-AUTO (85.98%) out performed this space by
closing almost 3% higher. But, this was mainly due to
short covering. Thus, unless we don’t see any buying
interest one should avoid adding longs.
HEROMOTOCO (56.60%) has lowest rollovers in this
space. This counter was down 4% and we also saw
decent fall in OI. It had a strong support around
3030-3020 levels, which is already breached. We
believe fresh shorts may attract this counter to push it
towards 2700-2750.
Consumer Goods & FMCG
TATAGLOBAL (88%) concluded the series with a cut of
1.60% and we also saw 25% decline in OI series on
series. At present, 225-227 is an immediate support;
whereas, 242-244 is the wall of resistance. A move
beyond this shall decide its trend going ahead.
MCDOWELL-N (94.80%) has corrected 20% and also
added some shorts. It has been taking support near
505-507 zones in last couple of days. Thus, traders
who wish to add longs for some pull back can add
longs for the target of 548-550.
ITC (77.41%) corrected 8% last series but we hardly
saw any short formation. This counter has a support
around 285-287 levels, one can add longs on dips.
For Private Circulation Only
2
Derivatives Rollover Report
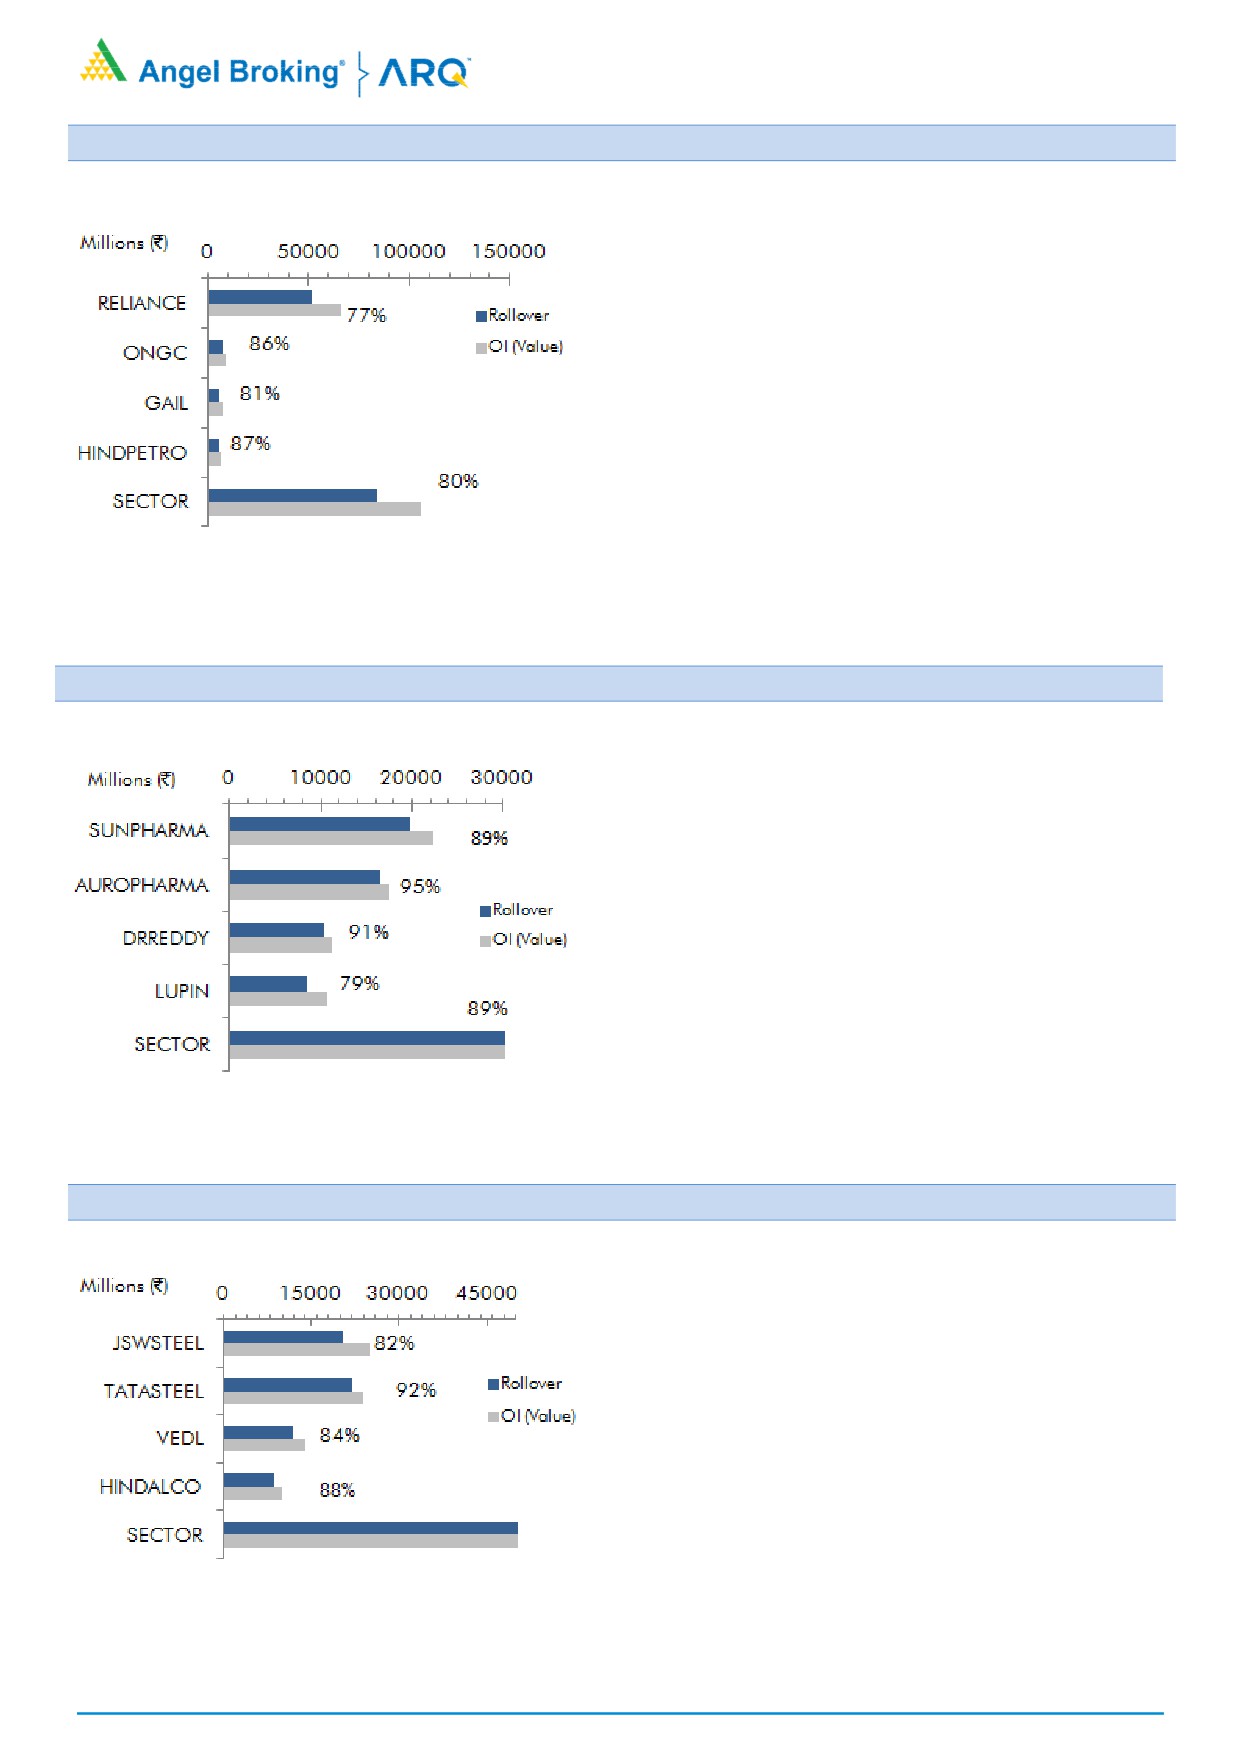
Oil & Gas
BPCL (72.69%) outperformed this space and also has
lowest rollovers. Low rollovers along with decline in
open interest hints, majority of the shorts are now out
of the system. Thus, we expect fresh buying emerging
in this counter.
GAIL (81.37%) has consolidated in the range of 350-
400 for last two consecutive series. At the same time,
open interest activity too remained muted. This
counter should be on watch list as it may soon be out
of this congestion.
Some of the other counters wherein we saw high
rollovers are PETRONET (94.74%), OIL (94.48%) and
MRPL (94.12%).
Pharmaceutical
BIOCON (91.09%) rallied 16% and outperformed the
entire F&O space. But, surprisingly, the overall OI
activity remained muted. Thus, traders are advised to
wait for any relevant fresh positions before initiating
aggressive positions.
AUROPHARMA (94.81%) rallied 7.64% along with
long formation. Rollovers are also on the higher side,
thus, any dips near the recent lows of 698-700 shall
be an opportunity to re-enter.
PEL
(93.84%) has underperformed this space by
correcting 24% last series. We also saw meaningful
short rollovers. This counter has an immediate
support around 2250-2255 levels; any fall below
these levels may bring it towards 2040-2050.
Metal & Mining
VEDL (83.87%) is the only counter that added longs
series on series. Rollovers are also inline to the
averages. Thus, traders with long positions shall hold
it with the stop loss of 219-220.
NMDC (79.80%) outperformed its peer groups.
However, the up move seen of 7% was mainly due to
short covering. In fact, in last couple of session we
are witnessing fresh shorts. At present, 125-127 is an
important hurdle for this counter. Hence, traders with
longs shall look to exit this counter.
Other stocks where we witnessed long unwinding are
COALINDIA
(79.21%), SAIL
(88.26%)
and
NATIONALUM (89.17%).
For Private Circulation Only
3
Derivatives Rollover Report
Average
Price
OI
Rollover
Change
Change
Rollover
(3month)
Scrip
Price
(%)
OI Futures
(%)
COC (%)
PCR-OI
(%)
(%)
AUTO & AUTO ANCILLARIES
AMARAJABAT
760.85
(10.30)
1005900
(14.46)
9.67
1.48
65.62
73.18
APOLLOTYRE
223.65
(11.53)
12978000
(7.80)
9.39
0.80
85.26
76.17
ASHOKLEY
121.15
(8.22)
59820000
4.84
8.12
0.45
94.59
89.95
BAJAJ-AUTO
2802.45
2.85
2410750
(28.12)
8.85
0.53
85.98
86.12
BALKRISIND
1051.65
(25.71)
1886400
45.38
7.73
0.91
73.76
82.78
BHARATFORG
617.20
(8.47)
8036400
(4.48)
10.11
0.66
87.85
92.01
BOSCHLTD
19935.65
(9.99)
117000
(4.92)
11.04
0. 00
80.33
92.19
CASTROLIND
145.80
(8.24)
9685200
(9.38)
-11.96
1.20
83.15
80.60
CEATLTD
1181.60
(16.31)
1056300
(11.21)
9.00
0.86
78.21
82.41
EICHERMOT
25064.20
(9.96)
241975
(13.65)
8.48
0.28
78.54
83.39
ESCORTS
650.35
(26.66)
5850900
15.68
9.39
0.58
87.86
89.97
EXIDEIND
268.35
(6.47)
4992000
(33.76)
9.30
0.81
76.71
82.24
HEROMOTOCO
3108.70
(4.21)
1044000
(28.55)
8.70
1.34
56.60
74.24
M&M
881.55
(10.67)
12901000
(7.68)
6.09
0.55
83.16
86.19
MARUTI
7608.50
(17.98)
3009750
31.50
9.57
0.32
80.26
85.45
MOTHERSUMI
260.55
(16.41)
15230400
25.05
6.03
0.50
86.84
90.64
MRF
64791.65
(12.02)
28560
(16.95)
11.95
0.06
84.97
89.22
TATAMOTORS
227.10
(13.06)
76753500
(4.45)
10.71
0.32
87.48
89.82
TATAMTRDVR
119.50
(14.18)
32169200
(2.67)
9.34
1.28
93.80
93.24
TVSMOTOR
573.25
1.67
5902000
17.99
-30.32
0.44
82.48
88.84
BANKING & FINANCIALS
ALBK
35.80
(15.17)
18293000
4.20
-23.25
0.91
97.19
96.94
AXISBANK
603.75
(7.55)
37615200
(15.24)
7.82
0.58
84.23
87.23
BAJAJFINSV
6023.40
(13.78)
618125
(21.58)
9.50
1.40
77.19
80.60
BAJFINANCE
2217.75
(24.88)
7156000
16.76
8.01
0.65
88.33
86.42
BANKBARODA
105.05
(30.59)
72284000
16.30
8.74
0.61
91.27
88.69
BANKINDIA
80.85
(19.55)
20388000
(11.33)
6.48
0.80
86.99
85.34
BHARATFIN
1050.40
(8.68)
3994500
(11.90)
8.87
1.14
89.15
86.27
CANBK
229.25
(20.58)
8600000
(15.27)
9.16
0.98
87.90
88.16
CANFINHOME
228.65
(28.21)
3857500
(12.58)
7.74
0.29
96.56
97.76
CAPF
500.35
(23.95)
5317600
(11.15)
3.26
1.17
93.96
92.48
CHOLAFIN
1186.40
(19.38)
996500
15.20
8.02
1.90
87.68
73.79
DCBBANK
143.65
(18.66)
5305500
44.13
-56.85
0.29
97.92
94.54
DHFL
291.85
(56.43)
15234000
(43.43)
7.41
0.58
88.01
90.75
EQUITAS
127.15
(20.18)
14252000
(8.85)
8.77
1.65
89.23
93.68
FEDERALBNK
70.70
(13.09)
48301000
(30.30)
5.55
0.87
86.27
88.68
HDFC
1741.20
(10.39)
24599000
1.37
9.20
0.53
83.13
86.63
HDFCBANK
1983.35
(4.47)
12646500
(37.32)
4.75
0.68
65.32
74.80
For Private Circulation Only
4
Derivatives Rollover Report
Average
Price
OI
Rollover
Change
Change
Rollover
(3month)
Scrip
Price
(%)
OI Futures
(%)
COC (%)
PCR-OI
(%)
(%)
IBULHSGFIN
944.00
(25.78)
13498000
(6.00)
5.97
0.80
88.18
82.89
ICICIBANK
308.95
(10.62)
92628250
(9.19)
9.78
0.73
79.79
83.52
ICICIPRULI
339.15
(10.86)
4382300
(7.90)
6.37
1.01
88.66
81.80
IDBI
49.20
(19.93)
53320000
(4.00)
9.34
1.01
88.47
95.03
IDFC
40.45
(24.11)
119724000
(2.81)
8.11
0.83
92.18
92.65
IDFCBANK
36.90
(24.46)
117689000
(9.03)
8.89
0.86
89.76
92.59
IFCI
12.35
(28.82)
61050000
(0.77)
-5.26
0.98
94.25
92.07
INDIANB
228.10
(32.19)
5006000
5.66
8.34
0.30
87.12
81.96
INDUSINDBK
1692.45
(10.25)
5229600
(7.49)
8.10
0.44
68.71
71.04
KOTAKBANK
1151.45
(10.16)
10888000
(5.57)
10.27
0.74
73.60
74.90
KTKBANK
100.55
(15.93)
16465500
(7.97)
8.48
1.19
91.13
90.86
L&TFH
126.05
(32.03)
40396500
42.99
7.80
0.57
88.78
90.73
LICHSGFIN
423.40
(20.09)
9700900
(22.16)
7.74
0.69
83.66
87.10
M&MFIN
402.95
(18.64)
10095000
0.90
11.09
0.84
91.87
92.08
MANAPPURAM
76.05
(25.15)
19200000
28.00
8.63
1.11
85.56
82.84
MFSL
422.20
(9.71)
2234400
(2.77)
9.80
1.47
81.88
90.87
MUTHOOTFIN
407.10
(1.38)
2280000
22.78
-27.89
0.50
83.29
86.15
ORIENTBANK
63.35
(25.91)
13338000
5.06
3.09
0.86
96.28
97.94
PFC
79.60
(7.28)
79326000
3.04
8.24
0.80
89.23
85.71
PNB
63.00
(26.53)
118519500
(2.11)
10.43
0.57
89.40
91.40
RBLBANK
527.05
(16.62)
4669200
0.18
9.59
0.73
82.66
82.84
RECLTD
98.80
(16.62)
41538000
10.12
11.31
1.08
88.43
85.72
RELCAPITAL
294.75
(35.28)
9966000
2.61
8.23
0.35
78.52
72.21
REPCOHOME
413.55
(25.02)
598500
(21.21)
-49.72
2.14
94.33
95.22
SBIN
266.25
(13.97)
77823000
(3.02)
4.42
0.72
82.10
81.08
SOUTHBANK
13.70
(22.60)
131172078
(7.02)
14.43
1.56
83.96
86.73
SREINFRA
33.10
(39.04)
18186000
(1.07)
-3.93
0.80
91.38
92.06
SRTRANSFIN
1160.60
(14.03)
4671000
5.52
12.19
1.39
84.45
85.54
SYNDIBANK
32.00
(21.95)
25875000
(5.49)
-2.03
0.60
94.85
97.30
UJJIVAN
263.40
(25.90)
4480000
(28.09)
8.72
1.15
79.48
83.38
UNIONBANK
68.05
(25.42)
37080000
11.01
8.68
0.98
86.82
90.97
YESBANK
204.80
(43.85)
91189000
61.81
9.94
0.34
83.69
84.59
CAPITAL GOODS & INFRASTRUCTURE
ADANIPORTS
336.55
(12.91)
9570000
16.96
5.05
0.83
80.17
81.00
BEML
629.95
(23.06)
1844000
2.99
7.81
0.49
97.49
98.19
BHEL
71.20
(11.55)
36022500
(1.03)
1.83
0.80
87.28
86.84
CGPOWER
46.50
(22.76)
35124000
(5.21)
-1.40
1.19
92.31
96.05
ENGINERSIN
122.70
(3.73)
10430000
12.33
4.26
0.82
68.89
82.03
GMRINFRA
16.85
(16.58)
199305000
(11.76)
3.88
0.72
89.37
91.44
HAVELLS
615.85
(14.92)
4000000
16.75
6.92
0.76
86.82
86.63
HCC
11.60
(21.36)
37674000
7.33
5.64
0.73
95.40
93.04
IRB
137.65
(28.25)
13442500
(11.42)
8.10
0.48
86.60
92.57
For Private Circulation Only
5
Derivatives Rollover Report
Average
Price
OI
Rollover
Change
Change
Rollover
(3month)
Scrip
Price
(%)
OI Futures
(%)
COC (%)
PCR-OI
(%)
(%)
JPASSOCIAT
7.50
(36.71)
107168000
(28.30)
8.75
0.71
87.31
94.49
LT
1312.65
(3.23)
10674000
(20.92)
2.74
0.97
68.48
76.75
NBCC
62.10
(14.17)
22146000
6.19
9.52
0.89
89.54
89.56
RELINFRA
305.60
(33.30)
8255000
(7.64)
7.94
0.52
81.16
87.60
SIEMENS
948.85
(6.31)
1484000
1.50
-2.33
0.80
99.60
98.54
VOLTAS
531.70
(15.17)
3146000
(19.85)
-10.82
0.71
78.12
78.58
CEMENT
ACC
1569.75
(4.14)
1430400
(6.26)
7.10
0.53
88.71
87.01
AMBUJACEM
227.25
(4.92)
13100000
11.87
0.00
0.64
86.63
84.45
DALMIABHA
2363.55
(11.55)
379500
(14.76)
-4.07
0.67
88.46
86.32
GRASIM
1031.90
(3.98)
3556500
(33.05)
8.14
1.09
79.43
79.13
INDIACEM
105.00
(16.63)
17181500
(14.85)
6.24
0.68
84.06
83.12
RAMCOCEM
650.00
(6.62)
688800
(31.56)
-1.00
0. 00
75.79
86.42
SHREECEM
17525.95
(7.25)
99800
4.01
7.33
0. 00
92.54
86.43
ULTRACEMCO
4126.30
(6.95)
2077600
(4.46)
1.87
1.02
83.94
82.29
CHEMICALS & FERTILIZERS
GSFC
94.15
(21.11)
13450500
(8.17)
6.26
1.47
95.37
86.25
PIDILITIND
1061.85
(7.32)
3102000
(6.87)
6.66
0.93
93.27
94.37
TATACHEM
687.30
(10.09)
2880750
(17.01)
10.42
0.93
93.41
89.18
UPL
687.50
(1.85)
14721600
(11.87)
8.40
0.99
88.82
81.68
CONSUMER GOODS & FMCG
ASIANPAINT
1291.65
(6.96)
5041800
(9.10)
4.20
0.91
66.67
74.73
BERGEPAINT
290.55
(14.13)
1861200
2.05
-1.79
6.27
94.84
91.07
BRITANNIA
5723.85
(14.84)
1332200
6.52
5.50
1.45
92.12
92.29
COLPAL
1100.75
(5.14)
1409100
(28.13)
-2.89
0.90
87.26
88.57
DABUR
439.90
(9.06)
14290000
4.57
7.75
0.66
89.63
93.96
GODFRYPHLP
748.80
(16.10)
592900
14.77
0.70
0.44
94.85
96.27
GODREJCP
791.10
(18.13)
4016400
41.94
12.73
2.13
84.43
81.63
HINDUNILVR
1630.65
(8.53)
8592600
(5.70)
8.49
0.65
79.00
80.70
ITC
295.00
(8.26)
62767200
(17.85)
7.56
0.46
77.41
81.61
JUBLFOOD
1248.00
(18.84)
3236000
14.49
9.52
0.54
82.17
78.90
MARICO
337.90
(9.52)
8288800
16.48
4.65
0.71
93.85
92.63
MCDOWELL-N
518.70
(20.46)
10823750
12.92
9.75
1.08
94.80
91.89
NESTLEIND
9630.60
(15.39)
333100
26.46
7.07
0.89
90.20
92.95
TATAGLOBAL
234.00
(1.60)
10894500
(25.02)
4.19
0.75
88.31
85.87
TITAN
824.45
(6.93)
13482000
(13.86)
4.76
0.69
87.93
89.12
UBL
1421.25
(0.72)
1579200
(23.73)
3.91
0.63
95.39
97.85
For Private Circulation Only
6
Derivatives Rollover Report
Average
Price
OI
Rollover
Change
Change
Rollover
(3month)
Scrip
Price
(%)
OI Futures
(%)
COC (%)
PCR-OI
(%)
(%)
METALS & MINING
COALINDIA
277.65
(3.34)
17534000
(7.17)
6.61
1.12
79.21
77.38
HINDALCO
245.45
1.97
35770000
(6.07)
8.28
0.55
87.57
87.20
HINDZINC
293.45
(0.32)
7366400
(1.71)
-53.87
0.33
84.32
78.87
JINDALSTEL
225.20
0.36
29241000
(4.68)
9.33
0.63
93.25
90.32
JSWSTEEL
402.00
0.53
50976000
(13.89)
5.54
0.46
81.76
91.31
NATIONALUM
65.15
(15.06)
49264000
(2.56)
7.04
0.99
84.93
78.51
NMDC
118.55
7.24
21138000
(17.99)
4.41
0.83
79.80
86.77
SAIL
74.65
(8.80)
69756000
(9.38)
7.91
0.77
88.26
87.49
TATASTEEL
612.85
0.08
35804506
(13.93)
2.77
0.65
92.12
92.03
VEDL
241.55
4.41
48853000
3.65
4.88
0.37
83.87
88.13
INFORMATION TECHNOLOGY
HCLTECH
1099.60
7.27
7390600
(16.99)
8.83
0.42
76.45
79.82
HEXAWARE
438.60
0.54
4105500
(27.73)
9.28
0.47
87.64
94.14
INFY
723.15
1.67
25678800
(43.84)
-2.97
0.61
61.58
77.25
KPIT
243.20
(18.61)
9400500
22.09
10.26
0.38
93.76
96.20
MINDTREE
1060.30
0.08
3630000
(9.27)
9.85
0.55
88.68
81.43
NIITTECH
1128.15
(16.57)
1770000
50.32
10.31
0.67
97.16
94.81
OFSS
3965.80
(5.77)
340200
73.66
-5.92
0.00
61.95
84.31
TATAELXSI
1185.40
(16.32)
1788800
(12.89)
10.53
0.38
87.96
87.15
TCS
2201.55
5.20
6689000
(21.05)
7.56
1.02
64.62
77.85
TECHM
750.40
2.00
14442000
(7.93)
7.60
0.73
87.43
85.84
WIPRO
321.20
6.92
27112800
11.10
9.20
0.30
73.56
81.57
MISCELLANIOUS
ADANIENT
143.05
(36.54)
37764000
89.16
7.33
0.37
94.75
93.72
APOLLOHOSP
1075.25
(10.12)
1233000
0.37
9.40
0.76
91.27
87.99
BATAINDIA
989.20
(9.71)
1639000
(10.78)
7.49
0.71
75.03
85.29
BEL
82.70
(28.15)
38298150
46.78
10.33
0.67
85.70
89.84
CONCOR
624.10
(1.35)
2171250
(2.25)
6.93
0.94
89.58
74.22
CUMMINSIND
679.00
(13.22)
1180900
91.05
8.41
0.48
82.17
74.83
GODREJIND
524.40
(17.37)
1884000
(4.41)
-3.59
1.09
98.82
92.17
INDIGO
843.35
(10.83)
3099000
(20.32)
5.90
1.45
89.86
90.52
INFIBEAM
202.30
(10.55)
40308000
2.56
12.69
1.41
75.66
77.47
JETAIRWAYS
169.15
(41.53)
6534000
20.30
-101.29
1.11
92.05
89.11
JISLJALEQS
72.35
(15.13)
35874000
(5.43)
6.34
0.71
88.62
92.76
JUSTDIAL
506.90
(9.41)
2214800
(18.87)
9.06
0.54
97.78
97.38
KAJARIACER
382.65
(19.91)
2501000
37.87
8.57
1.20
87.29
85.53
KSCL
614.20
(4.66)
733500
(22.63)
7.36
0.65
92.44
89.05
For Private Circulation Only
7
Derivatives Rollover Report
Average
Price
OI
Rollover
Change
Change
Rollover
(3month)
Scrip
Price
(%)
OI Futures
(%)
COC (%)
PCR-OI
(%)
(%)
MCX
716.15
(13.78)
4400200
(7.19)
9.63
0.98
93.99
94.98
PCJEWELLER
67.20
(22.00)
8382000
(2.36)
4.87
0.59
76.29
79.79
VGUARD
180.00
(20.41)
2499000
(14.39)
9.48
0.31
98.58
95.52
OIL & GAS
BPCL
374.55
4.32
8017200
(27.27)
8.23
0.69
72.69
62.64
CHENNPETRO
283.40
(9.62)
1108500
(3.02)
1.84
0.66
88.93
84.90
GAIL
380.00
0.28
15385923
(2.40)
7.94
0.65
81.37
78.46
HINDPETRO
250.80
(1.70)
23758875
(12.09)
7.58
0.93
87.40
87.63
IGL
257.90
(10.68)
3371500
(33.69)
3.80
1.25
80.66
73.83
IOC
153.85
(1.12)
24924000
(11.91)
10.25
0.92
76.78
71.49
MGL
828.45
(1.88)
2442600
(42.86)
0.00
0.86
93.98
96.36
MRPL
74.85
(8.83)
5044500
(9.08)
2.62
0.75
94.12
90.79
OIL
216.60
0.98
3086292
0.33
8.79
0.54
94.48
94.25
ONGC
177.05
(0.23)
43440000
3.27
9.27
0.26
85.96
80.87
PETRONET
228.45
(3.67)
12480000
(21.03)
8.33
0.41
94.74
89.91
RELIANCE
1261.90
(1.78)
40687000
(14.44)
8.47
0.64
77.28
83.68
PHARMACEUTICAL
AJANTPHARM
1106.00
(12.10)
646000
(23.37)
5.09
1.72
95.49
95.01
AUROPHARMA
745.90
7.64
22219000
5.88
9.33
0.59
94.81
94.57
BIOCON
710.15
16.37
6987600
(1.40)
3.22
0.25
91.09
90.47
CADILAHC
390.45
(0.20)
11169600
(19.08)
5.03
0.56
87.84
91.49
CIPLA
659.50
0.83
10453000
4.00
0.30
0.60
76.30
75.97
DIVISLAB
1376.55
5.77
2328000
(28.20)
10.16
0.46
90.91
86.13
DRREDDY
2560.25
6.79
4009750
(5.86)
9.88
0.65
91.17
89.37
GLENMARK
647.85
(2.06)
3399000
(11.94)
6.98
0.92
91.17
92.73
GRANULES
99.10
(12.69)
14190000
7.70
5.95
0.47
91.02
91.80
LUPIN
903.65
0.36
9390500
(11.71)
10.62
1.14
79.22
84.75
PEL
2383.30
(24.14)
3326832
23.46
9.50
0.51
93.84
94.87
STAR
463.90
(6.00)
4692000
(4.49)
4.94
0.51
94.29
86.99
SUNPHARMA
633.10
(1.31)
31255400
(12.83)
3.82
0.52
88.81
90.68
TORNTPHARM
1692.05
(5.27)
577000
(6.33)
10.21
0.71
89.39
88.66
WOCKPHARMA
565.70
(15.86)
3367800
(5.07)
1.73
0.65
96.44
98.10
REAL ESTATE
DLF
173.25
(21.98)
26162500
(3.31)
10.24
0.81
90.37
90.58
NCC
79.00
(20.32)
46224000
(0.70)
6.63
0.46
86.52
88.52
For Private Circulation Only
8
Derivatives Rollover Report
POWER
ADANIPOWER
25.75
(25.90)
146700000
(0.85)
5.08
1.76
96.73
97.61
CESC
876.90
(13.29)
5893250
12.27
6.72
0.49
93.08
93.45
NHPC
23.05
(7.62)
22896000
1.31
8.54
0.69
83.46
88.83
NTPC
168.95
0.63
33628000
(0.27)
7.76
0.31
77.89
79.09
POWERGRID
195.45
0.41
40368000
2.24
6.03
0.92
87.49
84.38
PTC
68.50
(17.72)
11344000
(22.60)
6.69
0.77
89.52
75.41
RPOWER
25.95
(29.58)
49829000
(1.34)
-7.49
0.71
94.29
96.75
SUZLON
6.05
(15.38)
313605000
0.69
21.91
0.54
87.37
92.12
TATAPOWER
69.10
(9.97)
44559000
(10.24)
9.50
0.90
89.79
92.08
TORNTPOWER
224.45
(15.21)
1998000
5.88
7.30
4.27
83.77
92.31
TELECOM
BHARTIARTL
359.05
(6.80)
48067500
1.01
8.22
1.21
91.64
93.96
IDEA
38.80
(22.94)
154854000
1.40
10.16
0.64
91.56
94.09
INFRATEL
270.35
(5.22)
4127600
(36.37)
12.17
0.37
55.03
72.27
RCOM
12.30
(34.40)
95480000
(24.09)
-5.28
0.49
95.15
96.73
TATACOMM
508.10
(9.99)
3039200
(14.90)
8.52
0.80
93.18
94.89
TEXTILES
ARVIND
338.90
(16.29)
8158000
(6.55)
7.35
0.58
79.00
83.53
CENTURYTEX
856.20
(11.61)
6601650
22.28
8.97
1.93
89.66
92.68
PAGEIND
33004.85
(6.55)
120425
97.34
-2.35
0. 00
89.34
91.30
RAYMOND
705.50
(17.34)
5004800
3.70
7.15
2.25
90.25
94.23
SRF
1815.05
(11.78)
745500
(21.81)
3.96
2.18
92.21
94.60
MEDIA
DISHTV
57.70
(19.13)
36792000
(24.06)
7.96
1.62
89.82
88.82
PVR
1258.90
(8.31)
987600
(5.29)
3.95
3.29
96.63
94.77
SUNTV
624.05
(19.11)
6892000
(0.52)
8.52
1.04
85.28
87.35
TV18BRDCST
36.60
(20.95)
52266500
(6.42)
0.00
0.88
94.06
97.44
ZEEL
448.70
(12.23)
10238800
0.95
9.95
0.60
80.07
84.40
For Private Circulation Only
9
Derivatives Rollover Report
Research Team Tel: 022 - 39357800 Extn-6824
DISCLAIMER
Angel Broking Limited (hereinafter referred to as “Angel”) is a registered Member of National Stock Exchange of India Limited,
Bombay Stock Exchange Limited and Metropolitan Stock Exchange Limited. It is also registered as a Depository Participant with CDSL
and Portfolio Manager and Investment Adviser with SEBI. It also has registration with AMFI as a Mutual Fund Distributor. Angel
Broking Limited is a registered entity with SEBI for Research Analyst in terms of SEBI (Research Analyst) Regulations, 2014 vide
registration number INH000000164. Angel or its associates has not been debarred/ suspended by SEBI or any other regulatory
authority for accessing /dealing in securities Market. Angel or its associates/analyst has not received any compensation / managed
or co-managed public offering of securities of the company covered by Analyst during the past twelve months.
This document is solely for the personal information of the recipient, and must not be singularly used as the basis of any investment
decision. Nothing in this document should be construed as investment or financial advice. Each recipient of this document should
make such investigations as they deem necessary to arrive at an independent evaluation of an investment in the securities of the
companies referred to in this document (including the merits and risks involved), and should consult their own advisors to determine
the merits and risks of such an investment.
Reports based on technical and derivative analysis center on studying charts of a stock's price movement, outstanding positions and
trading volume, as opposed to focusing on a company's fundamentals and, as such, may not match with a report on a company's
fundamentals. Investors are advised to refer the Fundamental and Technical Research Reports available on our website to evaluate
the contrary view, if any.
The information in this document has been printed on the basis of publicly available information, internal data and other reliable
sources believed to be true, but we do not represent that it is accurate or complete and it should not be relied on as such, as this
document is for general guidance only. Angel Broking Limited or any of its affiliates/ group companies shall not be in any way
responsible for any loss or damage that may arise to any person from any inadvertent error in the information contained in this
report. Angel Broking Limited has not independently verified all the information contained within this document. Accordingly, we
cannot testify, nor make any representation or warranty, express or implied, to the accuracy, contents or data contained within this
document. While Angel Broking Limited endeavors to update on a reasonable basis the information discussed in this material, there
may be regulatory, compliance, or other reasons that prevent us from doing so.
This document is being supplied to you solely for your information, and its contents, information or data may not be reproduced,
redistributed or passed on, directly or indirectly.
Neither Angel Broking Limited, nor its directors, employees or affiliates shall be liable for any loss or damage that may arise from or
in connection with the use of this information.
Derivative Research Team
For Private Circulation Only
10